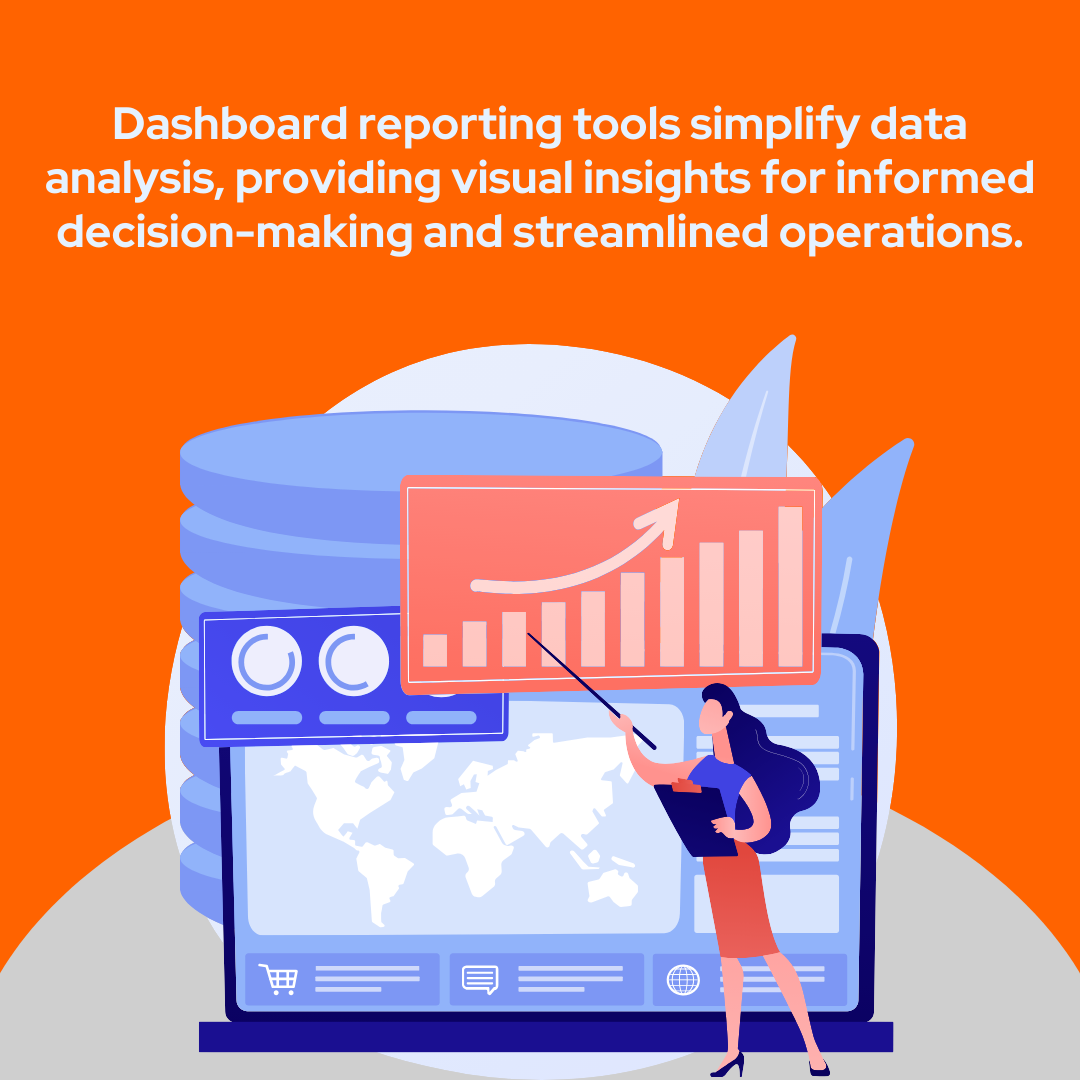
In today's data-driven business landscape, staying ahead of the competition and making informed decisions is crucial. Enter the world of dashboard reporting tools and dashboard software – powerful solutions designed to help businesses access, analyze, and visualize their key performance indicators (KPIs) effortlessly. These tools are not just a luxury; they're a necessity for modern organizations.
Here, we'll explore why dashboard reporting tools are indispensable for businesses of all sizes, how they boost efficiency, and their role in driving data-driven decision-making. Get ready to unlock the potential of your business with the right dashboard reporting tool at your disposal.
What are Dashboard Reporting Tools and Why are they important?
Dashboard Reporting Tools like Power BI, are user-friendly software solutions crucial for businesses, designed to simplify data management and analysis.
Dashboard Software offers easy-to-use and gathers data from different data sources, such as spreadsheets, databases, or cloud services.
The reporting tool creates a single hub for all this data, making it convenient for users to keep an eye on key performance indicators (KPIs) without getting lost.
Data visualization is another key strength. The custom dashboard reporting tools transform complex data into colorful charts, graphs, and interactive reports.
This visual representation makes it a breeze to spot patterns and understand data insights. It's like turning a jumble of numbers into a clear picture, aiding quick decision-making.
Dashboard reporting tools provide real-time insights, help businesses make informed decisions, and streamline their operations.
Whether you're a small startup or a large corporation, dashboard reporting tools are easy to use and help in a competitive and data-savvy business world.
What are the Benefits of using Dashboard Reporting Tools?
Dashboard Software reporting tool offers benefits for businesses of all sizes. These user-friendly tools make it simple for anyone to gather, analyze, and present data effectively.
Dashboard reporting tools are game-changers for businesses. They provide an efficient way to manage data, gain insights, and make informed decisions.
Many Custom dashboards offer free trials, so it's worth exploring different options to see which one best fits your needs.
With the power of data visualization and real-time updates, these tools are your ticket to smarter, more successful business operations.
Let's get into some of the key advantages:
1. Data Visualization
Dashboard reporting tools allow you to transform complex data into easy-to-understand visuals.
Charts, graphs, and tables make it a breeze to see trends and insights, helping you make better decisions. This technique can be proven to be very advantageous.
2. Real-Time Insights
Many reporting dashboards provide real-time data updates.
This means you can always have your finger on the pulse of your business, making timely and informed decisions.
3. Ease of Use
These tools are designed to be user-friendly.
Many of them offer drag-and-drop functionality, which means you can create and customize a pre-built dashboard without being a data expert.
4. Efficient Decision-Making
With all your essential data in one place, you can quickly analyze information and make data-driven decisions.
This efficiency can lead to improved strategies and performance.
5. Customization
Reporting dashboards are often highly customizable.
You can tailor them to your specific needs and preferences, ensuring you see exactly what matters most to your business. And then the company charges accordingly per month.
6. Cost Savings
Many dashboard reporting tools offer a free trial, allowing you to test their features and benefits without committing to a purchase upfront.
This can help you save money by choosing the right tool for your needs at low prices per month.
7. Data Accessibility
These tools often provide remote access, allowing you to view your reports and dashboards from anywhere.
This is especially helpful for businesses with remote or traveling employees.
8. Improved Communication
Reporting dashboards can be shared with team members or stakeholders, enhancing communication and ensuring everyone is on the same page when it comes to business performance.
Key Features of an Effective Dashboard Reporting Tool
Effective dashboard reporting tools are essential for businesses looking to make the most of their data.
These tools come with a range of key features that set them apart, making them indispensable for data-driven decision-making.
Here, we'll discuss six crucial features that make the best dashboard software stand out:
1. Interactive Dashboards
Interactive dashboards not only present data but also allow users to engage with it.
They offer the ability to click on charts or graphs for deeper insights, filter data in real time, and even provide interactive elements like drop-down menus.
This enhances data for user engagement and helps in uncovering hidden patterns and trends.
2. Drag-and-Drop Interface
A user-friendly drag-and-drop interface simplifies the process of creating and customizing dashboards.
With this feature, users can easily rearrange widgets, charts, and graphs without the need for coding skills.
It empowers users to create personalized dashboards that cater to their specific requirements with unmatched ease and flexibility.
3. Real-Time Data Updates
Real-time data updates ensure that your reporting dashboard is constantly refreshed with the latest information.
This means users can make decisions based on the most current data, helping organizations respond quickly to changes and emerging trends.
It's like having a live feed of your business's vital statistics.
4. Customization Options
The best dashboard software offers choices in visual style, color schemes, and layout.
Users can also add or remove widgets, charts, and tables, ensuring that the dashboard aligns with the company's branding and caters to specific reporting needs.
5. Data Integration
Effective dashboard reporting tools easily integrate with various data sources, such as databases, spreadsheets, and cloud services.
This integration allows users to pull data from multiple locations into a single central dashboard.
By simplifying data management and providing a comprehensive view of your business, it streamlines the process of data analysis.
6. Security and Access Control
Data security is a top priority. The best dashboard software provides robust security features, including role-based access control.
This allows administrators to regulate who can access, view, and modify the dashboard.
By granting specific permissions to users or teams, sensitive data remains confidential, ensuring data integrity and privacy.
Read this blog post for more information on the Benefits of Dashboard reporting tools.
Best Dashboard Reporting Tools
There are several types of dashboard reporting tools available in the market, each with its unique features and capabilities.
Here are some of the popular dashboard reporting tools, including their key features, pricing models, and integration options.
1. Google Analytics
Google Analytics is a popular web analytics tool that provides robust reporting capabilities.
While it primarily focuses on website traffic and user behavior analysis, it also offers dashboard reporting features.
With Google Analytics, users can create custom dashboards to monitor and track key metrics and performance indicators.
The tool offers a wide range of pre-built dashboards and widgets, allowing users to visualize data in a user-friendly manner.
Google Analytics is a free and easy-to-use tool, making it an attractive option for businesses of all sizes.
2. Power BI
Power BI is a comprehensive business intelligence tool offered by Microsoft. It enables users to create interactive dashboards and reports by connecting to various data sources, both internal and external.
Power BI offers advanced data visualization capabilities, including interactive charts, graphs, and maps.
The tool allows users to collaborate and share dashboards with team members and stakeholders.
Power BI offers both free and paid versions, with pricing starting at $9.99 per user per month for the Pro version.
3. Tableau
Tableau is a leading data visualization and dashboard reporting tool that caters to both beginners and advanced users.
Tableau offers a drag-and-drop interface and a wide range of visualization options to help users explore and analyze data effectively.
The tool provides seamless integration with various third-party applications and databases making it very easy to use.
Tableau offers a 14-day free trial, and pricing plans are available upon request.
4. Sunbase
Sunbase Dashboard Reporting Management is a dashboard software that is a comprehensive solution designed to ease your reporting needs.
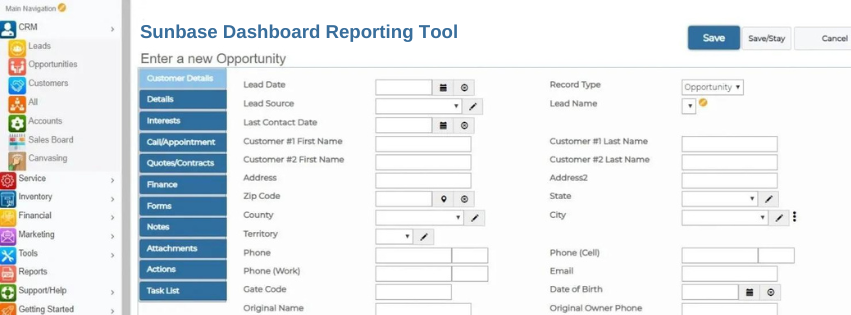
With a wealth of features at your disposal, it empowers your business to efficiently manage data and extract valuable insights.
Sunbase boasts over 50 report templates and a custom report builder, allowing you to tailor your reporting to your specific requirements.
Sunbase Dashboard Reporting Management's key features include creating multi-view metrics dashboards, and ensuring that important prospect and customer information is gathered, managed, and accessible at all times.
Sunbase is a versatile and user-friendly reporting solution tailored to enhance your business's data-driven decision-making.
5. Klipfolio
Klipfolio is a powerful dashboard reporting tool that offers a wide range of features for creating, designing, and sharing data dashboards.
With Klipfolio, users can connect to various data sources, including Google Analytics, and create visually appealing dashboards using pre-built templates and customizable widgets.
The tool provides real-time business data updates, advanced data visualization options, and collaboration features for team collaboration.
You can also read about different types of Dashboards.
Tips for Getting Maximum Value From Dashboard Reporting Tools
Dashboard reporting tools are powerful assets for businesses looking to convert raw data into actionable insights.
To get the maximum value from these tools and ensure effective decision-making, consider these six essential tips:
1. Align with Business Goals:
Start by aligning your dashboard reporting tools with your business objectives.
Clearly define the key performance indicators (KPIs) and metrics that matter most to your organization.
This ensures that your dashboards provide relevant insights for business users.
2. Select the Right Tool:
Choose a dashboard reporting tool that fits your needs. Assess whether a cloud-based or on-premises solution is more suitable.
Some cloud-based tools, like Google Data Studio, offer pre-built dashboards for popular data sources like social media platforms.
Select a tool that integrates seamlessly with your data sources and offers the customization options you require.
3. Data Quality and Consistency:
To derive accurate insights, and maintain high data quality and consistency, ensure that data sources are clean and regularly updated.
Inaccurate or inconsistent data can lead to misleading conclusions and poor decision-making.
4. Effective Data Visualization:
Utilize the data visualization capabilities of your dashboard reporting tools to their fullest extent. Create visually engaging charts, graphs, and reports.
Remember, effective data visualization not only simplifies data interpretation but also makes it more engaging for business users.
5. Regularly Review and Analyze Data:
The value of your dashboard reporting tools increases when you regularly review and analyze the data presented.
Set aside dedicated time to analyze trends, identify areas for improvement, and make data-driven decisions.
Make it a routine to check your dashboards and discuss findings with relevant teams.
6. User Training and Feedback:
Provide adequate training to business users on how to use the dashboard reporting tools effectively.
Encourage them to provide feedback on the tool's usability and the relevance of the displayed data.
Use this feedback to fine-tune the dashboards and make them more user-friendly and informative.
They will help convert raw data into actionable insights that support informed decision-making, ultimately driving your organization's success.
Conclusion
Dashboard reporting tools offer a powerful means for non-technical users to access, understand, and leverage data effectively. By aligning these tools with business goals, selecting the right platform, maintaining data quality, focusing on data visualization, regularly analyzing data, and providing user training, organizations can harness the maximum value from their dashboards.
Empowering non-technical users to make informed decisions, these tools play a pivotal role in improving operational efficiency, identifying growth opportunities, and staying competitive in today's data-driven business landscape.
About Sunbase
Sunbase helps companies succeed through a suite of Solar CRM tools like Solar Lead Management Software, Solar Proposal Software, etc.! To book your demo or an appointment, contact us here!


Contact Us
Quick Links
Sunbase on Mobile


Copyright ©2021
Terms of Service |
Privacy Policy